Services
Overview
The Services page shows the health of each part of your Shield deployment. This includes the Shield nodes (Web, ICAP, Alert). It also includes Redis and the activity search backend (Elasticsearch or OpenSearch).
The page has two views:
- The Services list. This table shows one row for each instance and its current status.
- A service detail page. Click an instance to see its live metrics, uptime history, and trend charts.
Use this page to check that each node is connected, to find an instance that is close to its limit or to confirm that Shield sends alert notifications correctly.
Services List
The table lists each service instance that Shield knows about. Each row shows one instance.
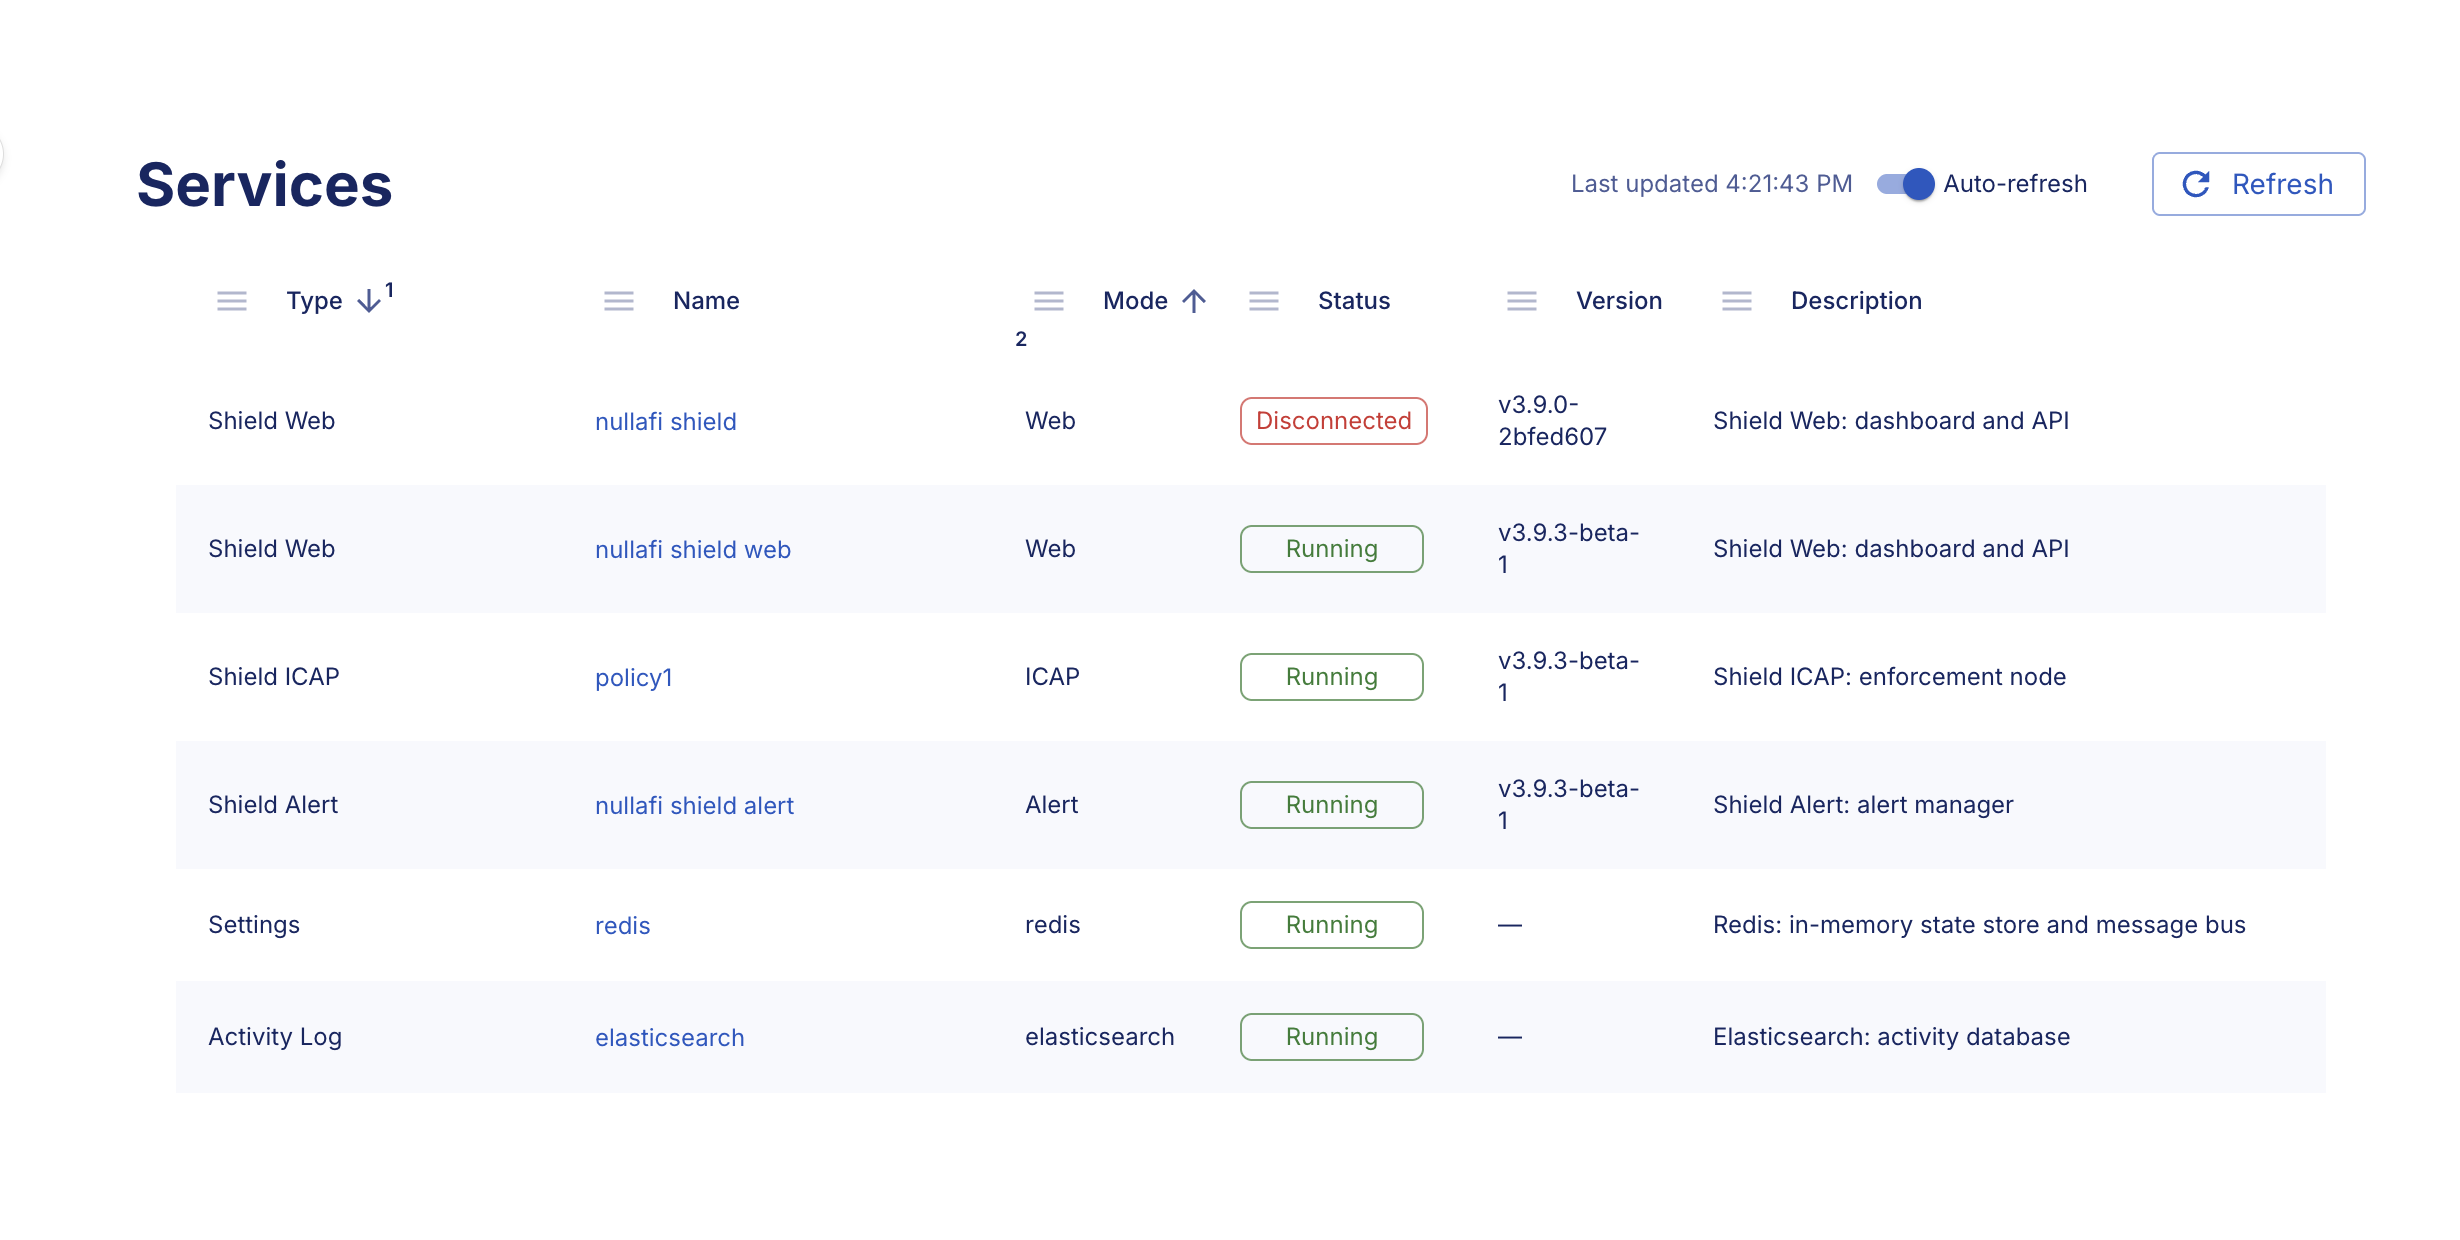
Columns
- Type — the role of the instance:
Shield Web,Shield ICAP,Shield Alert,Settings, orActivity Log. - Name — the instance name. Click the name to open the detail page for that instance.
- Mode — the operating mode of the instance, for example
Web,ICAP,Alert,redis, orelasticsearch. - Status — the connection state of the instance:
- Running — the instance is connected. It reports data normally.
- Disconnected — Shield has not received data from the instance recently. Check the container if the node should be running.
- Version — the Shield build the instance runs, for example
v3.9.2. Redis and the search backend show—in this column. - Description — a short description of the role of the instance.
Sort, Reorder, and Refresh
This table works like the Activity table. Click a column header to sort the table by that column. An arrow shows the sort direction. A number shows the sort order when you sort by more than one column. Drag the handle next to a header to move a column.
Use the controls at the top right to keep the table current:
- Last updated shows the time of the last data pull.
- Auto-refresh turns on automatic updates at a fixed interval.
- Refresh pulls new data immediately.
Service Detail Page
Click a service name to open its detail page. The page shows a summary card, plus panels with live metrics for that instance.
Use the Services link at the top left to return to the list. Use Refresh at the top right to pull new data for the instance.
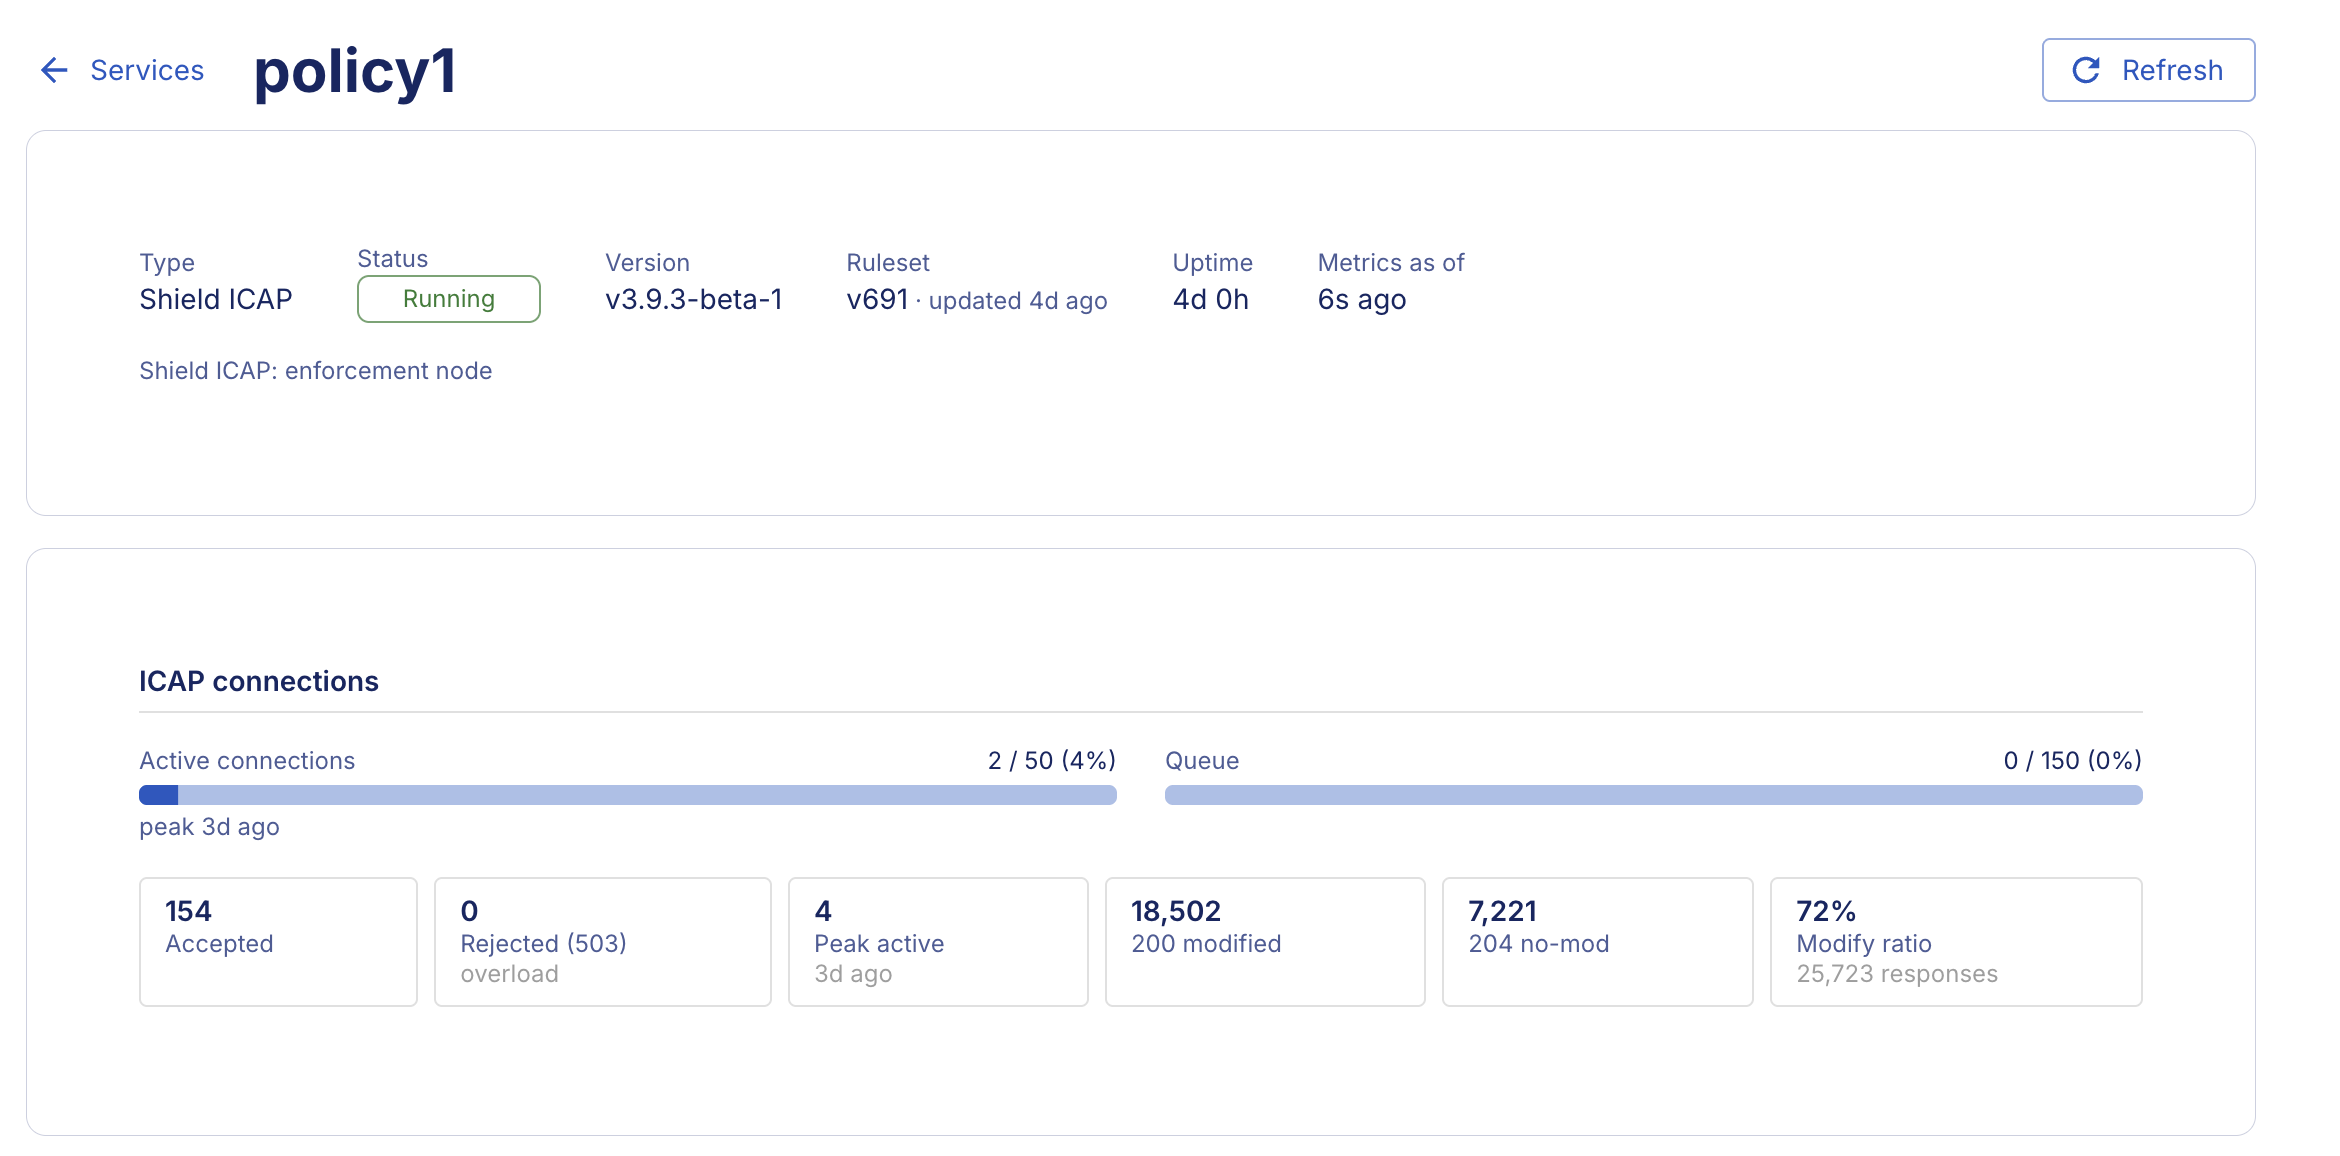
The summary card shows the instance Type, Status, Version, active Ruleset, Uptime, and how recent the metrics are (Metrics as of).
Below the summary card, Shield nodes (Web, ICAP, Alert) show:
- A service-specific panel — for example, the Shield ICAP page shows an ICAP connections panel with active connections, queue depth, and request counts against their configured limits.
-
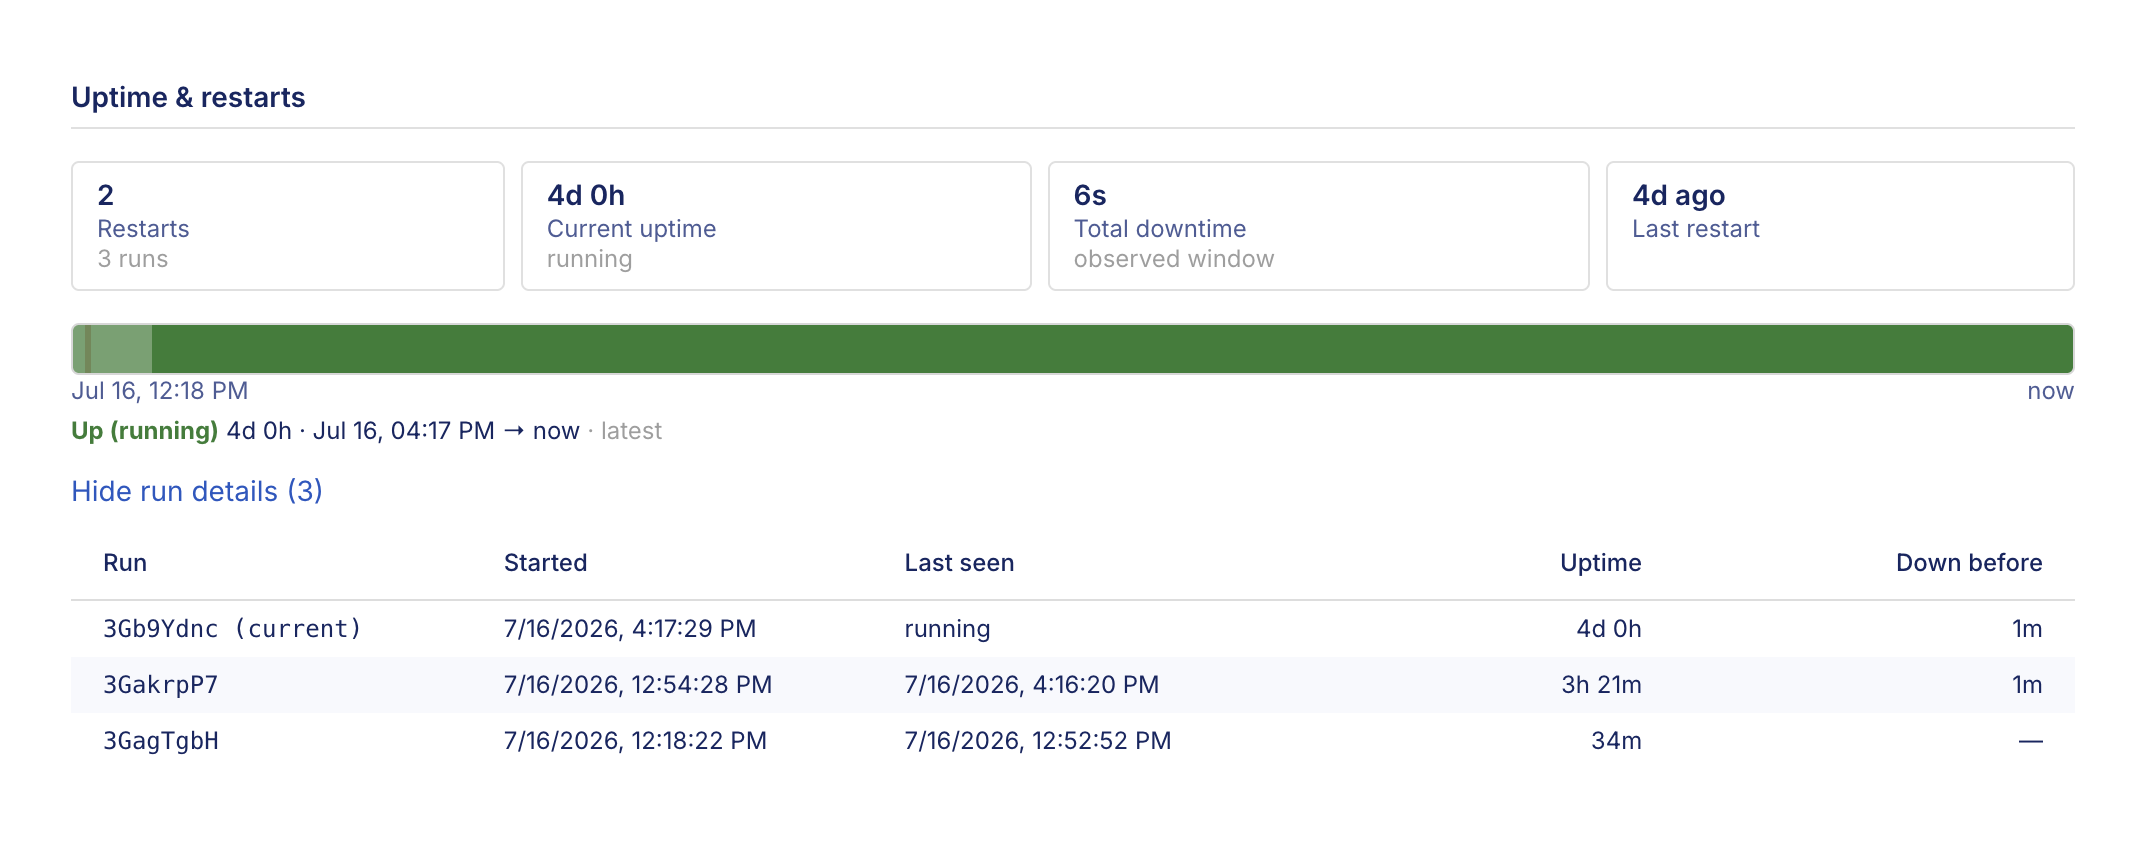
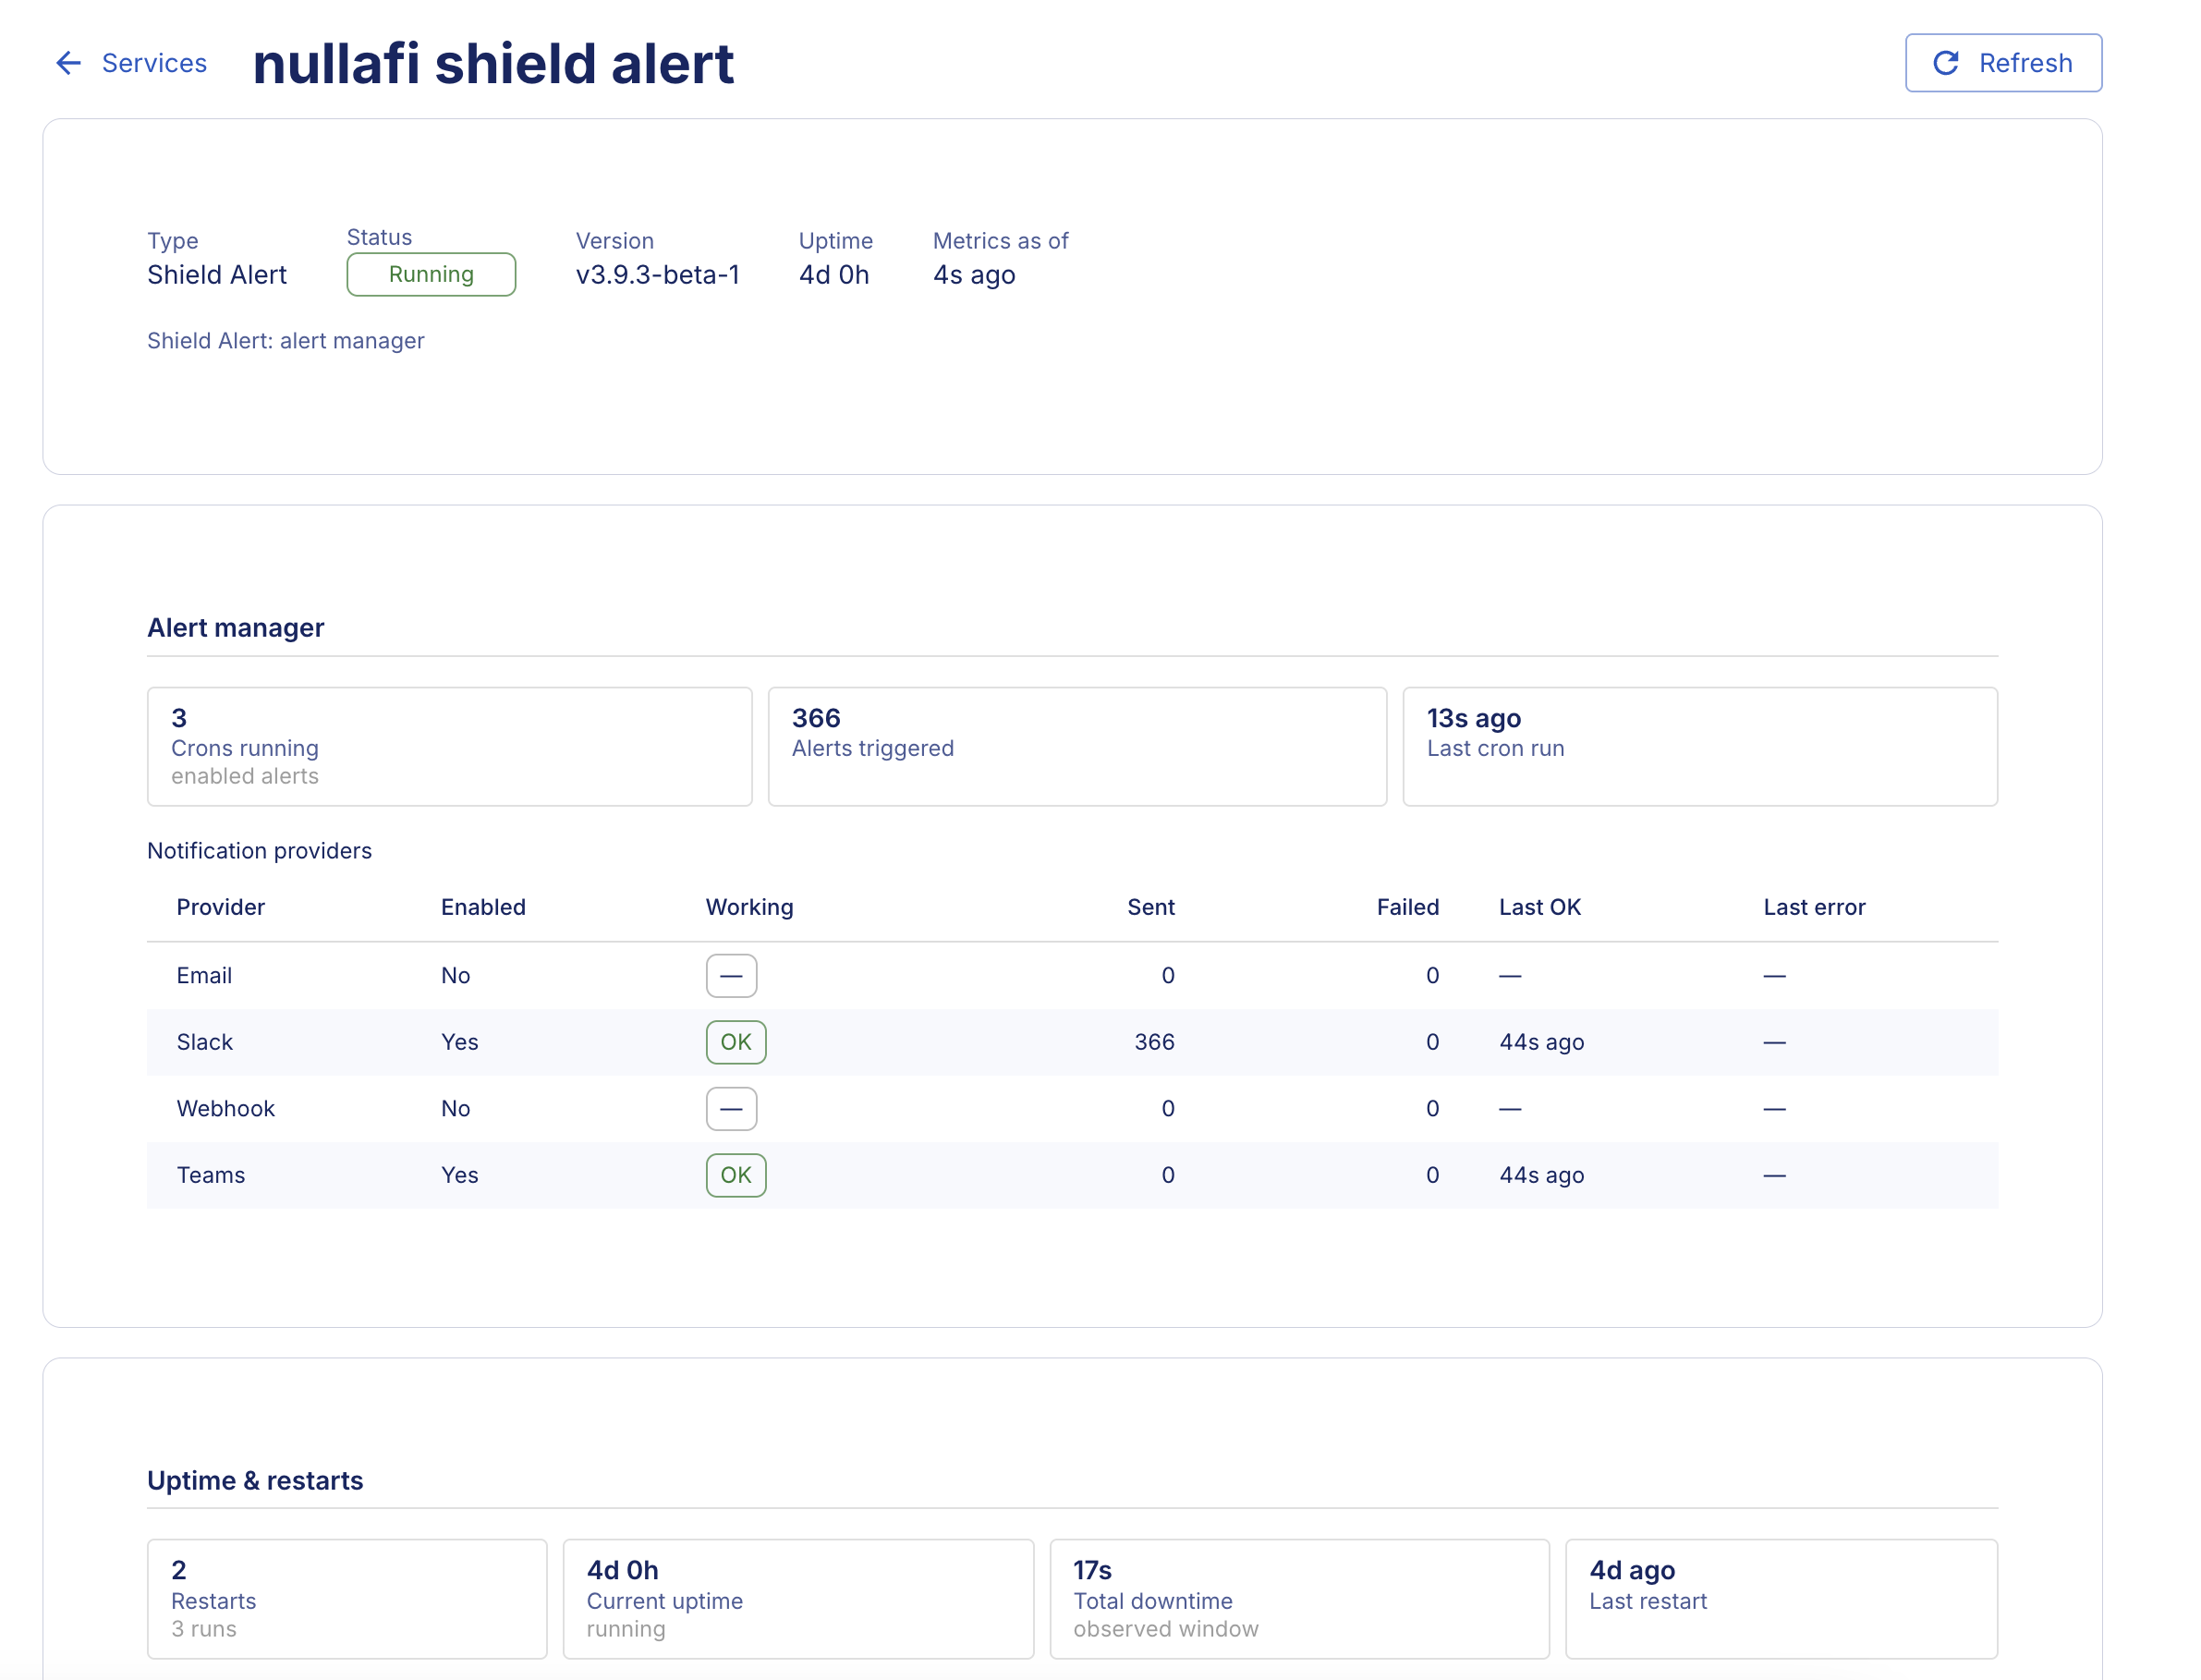
Uptime & restarts — restart count, current uptime, downtime, and a timeline of recent runs.
-
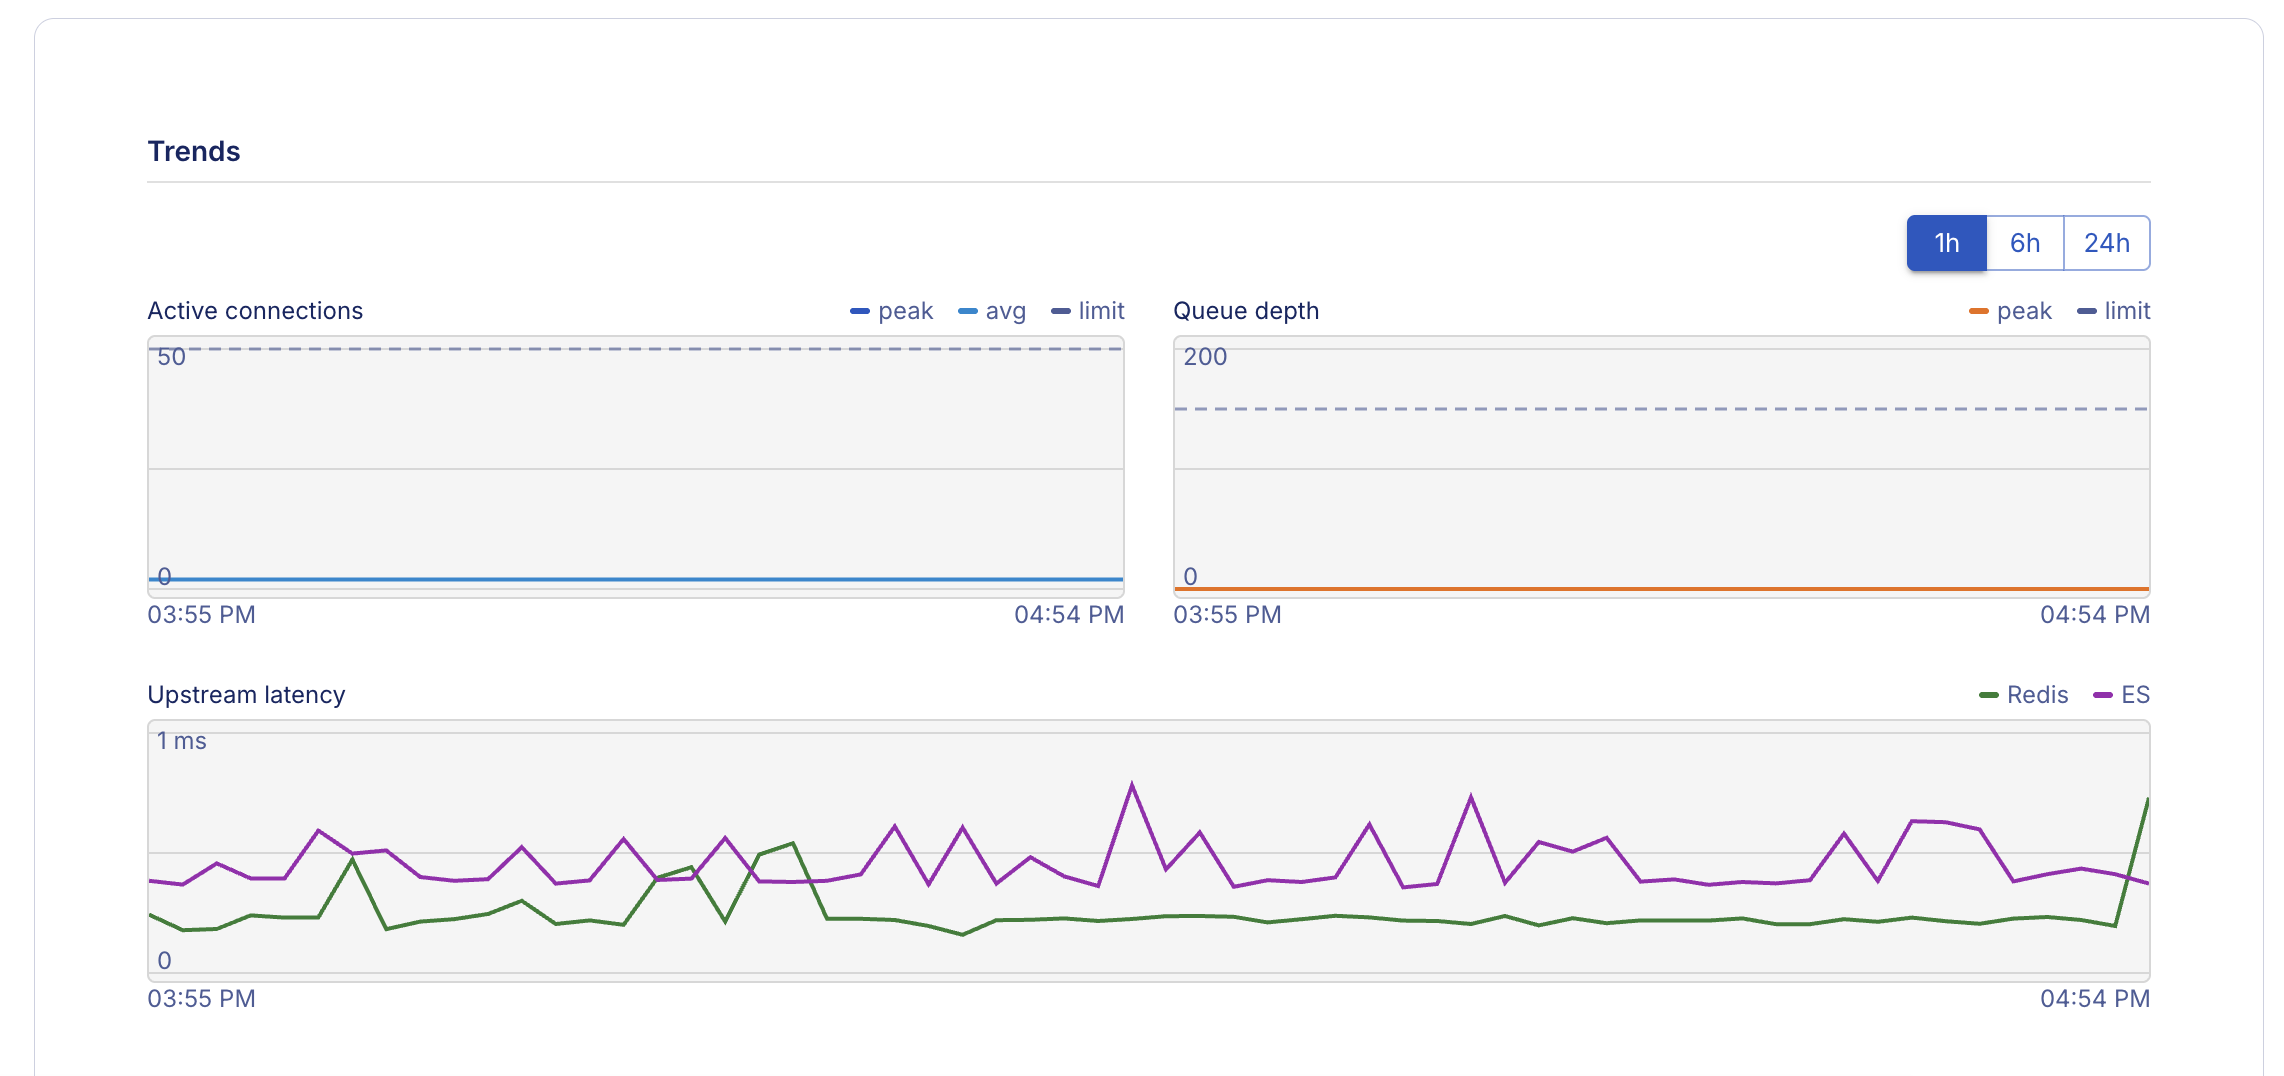
Trends — time-series charts (over 1h / 6h / 24h) for the key metrics of that service, such as connection and queue limits, and upstream latency to Redis and the search backend.
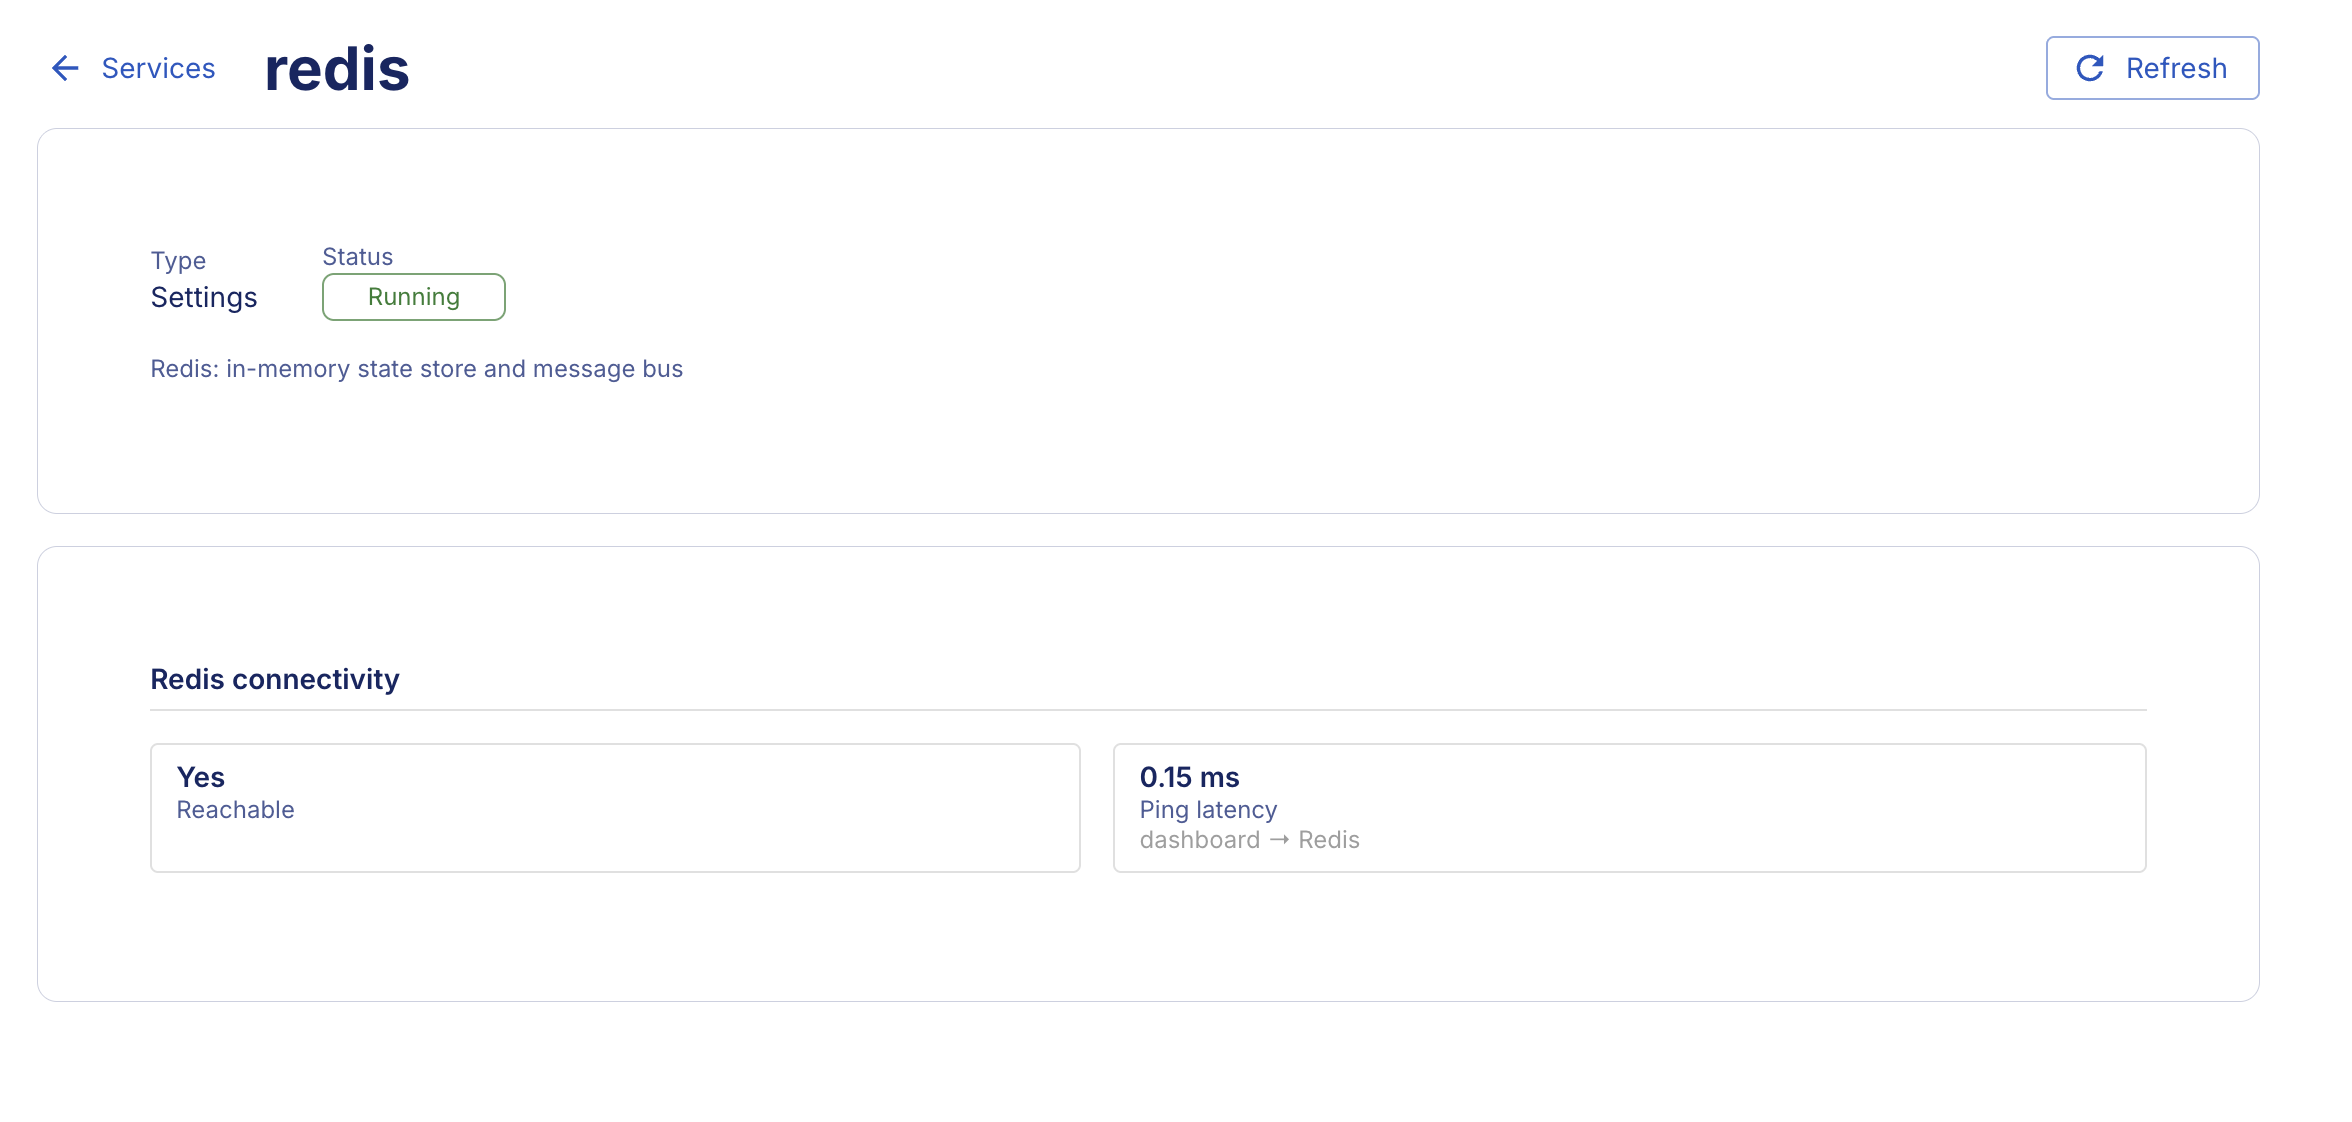
Redis and the search backend (Activity Log) show a simpler connectivity panel instead, with Reachable status and Ping latency.
The Shield Alert page adds an Alert manager panel showing cron activity and the status of each notification channel (Email, Slack, Webhook, Teams) — use it to confirm alerts are actually being delivered.
Refreshing Data
The list and each detail page show data from a point in time, not live data:
- On the list, turn on Auto-refresh for repeated updates, or click Refresh for a single update.
- On a detail page, click Refresh to pull new metrics for that instance. The Metrics as of field always shows how old the current data is.